xTalk
Overview#
The xTalk program is used to determine cross-talk coefficients between crystals in a Clover detector. It compares the energies in Clover multiplicity 1 spectra with those in gated multiplicity 2 spectra. This process requires high statistics, so multiple runs must be combined.
Configuration File: xTalk.conf#
CAL_FILE:             Path to the detector’s calibration file
ShiftTrack_Dir:       Path to the gain-drift alignment folder (one file per run)
LSTSortDir:           Path to the input files (Clover-built raw data)
OutputDir:            Path to store output files
Source:               Source used for analysis (60Co or 152Eu)
Notes:
- The calibration file provides approximate energy ranges for coefficient calculation
ShiftTrack_Dirensures gain matching across runs (see AnaRaw)LSTSortDirmust point to data processed with LSTClovBuilder- The
Sourcecan be60Coor152Eu
To display help, run:
Step 1: Generate M1 and Gated Spectra#
- Produces
XTalk_Histos.rootinOutputDir(or a custom name with-of Name) - Contains all Clover M1 spectra and 2D cross-talk matrices
- Required for analysis in the next step
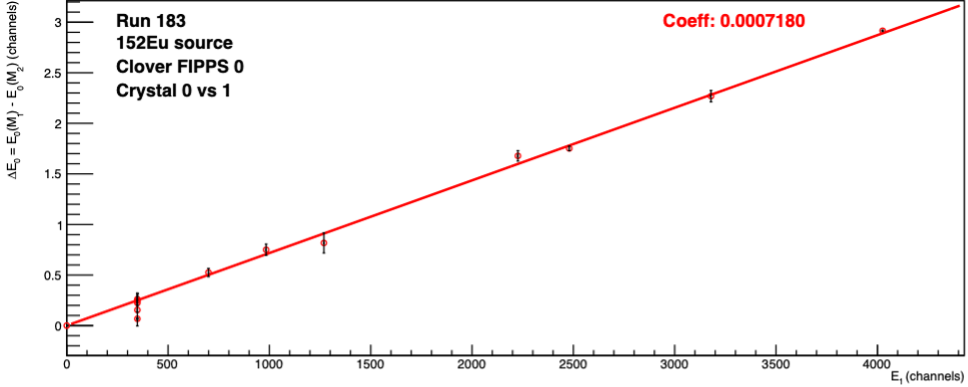
Step 2: Calculate Cross-Talk Coefficients#
In this example, OutputDir is ./InputPars.
- Computes the coefficient
xin:
where ΔE1 is the energy shift in Det1 when E2 is detected in Det2 - Produces:
xTalk.txt: contains all coefficients (for EventBuilder input)XTalk_Graphs.root: diagnostic plots for all detector combinations
Example output for a FIPPS Clover with a 152Eu source:
Optional Step 3: Mix Sources#
To combine results from multiple sources:
Produces:
Mixed_xTalk.txt: final coefficient fileMixed_XTalk_Graphs.root: combined graphs
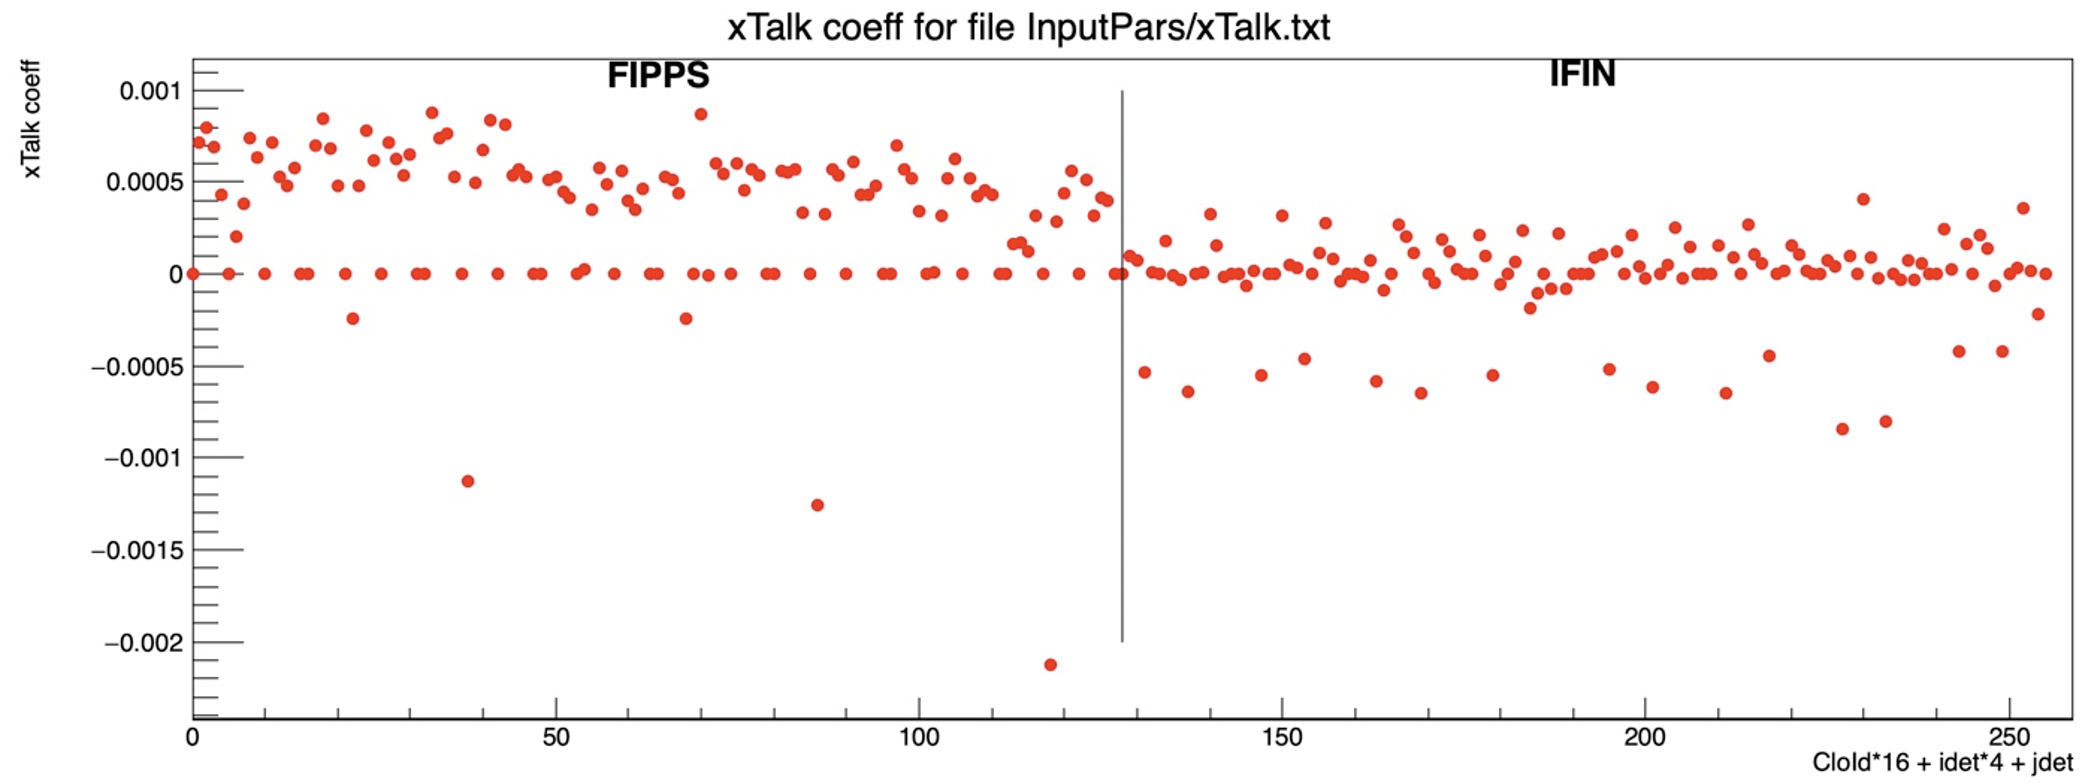
Optional Step 4: Plot Coefficients#
Generates a visual summary of all calculated coefficients: